Python for data analytics has become one of the most in-demand skills for professionals across every industry. The ability to collect, interpret, and visualize data using Python separates top performers from the rest. Businesses depend on data to make accurate decisions, forecast trends, and improve performance. If you’re in Toronto looking to strengthen your analytical skillset, learning Python opens a direct path toward high-value roles in finance, marketing, healthcare, and tech. This guide outlines five practical steps to master Python for data analytics and gain an edge in today’s data-driven market.
Key Takeaways
- Python for data analytics builds the foundation for decision-making and business forecasting across industries.
- You’ll need to learn Python fundamentals, essential libraries, and hands-on project skills to become job-ready.
- Building a portfolio and complementing technical ability with soft skills can fast-track your career in Toronto’s competitive data market.
Learning Python for Data Analytics
Python dominates the data analytics field because it’s simple, powerful, and adaptable. Whether you’re a beginner or already comfortable with coding, Python helps you handle everything from basic statistics to advanced predictive modeling. The language is free, open-source, and supported by an active global community that continuously improves its performance.
In data analytics, Python acts like a bridge connecting raw data with actionable insights. You can automate data cleaning, manage huge datasets, and visualize information to reveal business trends that would be impossible to see manually. Its flexibility makes it the preferred choice for analysts and business strategists alike.
Professionals in Toronto are discovering that Python proficiency opens doors to a wide range of roles, from data analyst and business intelligence specialist to marketing strategist and operations planner. Employers increasingly seek candidates who can translate data into real business results. Completing a recognized Python for Data Analytics training program positions you to meet this demand with confidence.
5 Steps to Master Python for Data Analytics
Learning Python effectively means following a clear path that builds from fundamentals to application. Each step prepares you for the next. From grasping syntax and libraries to applying concepts in real projects, every stage reinforces both technical skill and problem-solving confidence. These five steps form the backbone of professional-level analytics training.
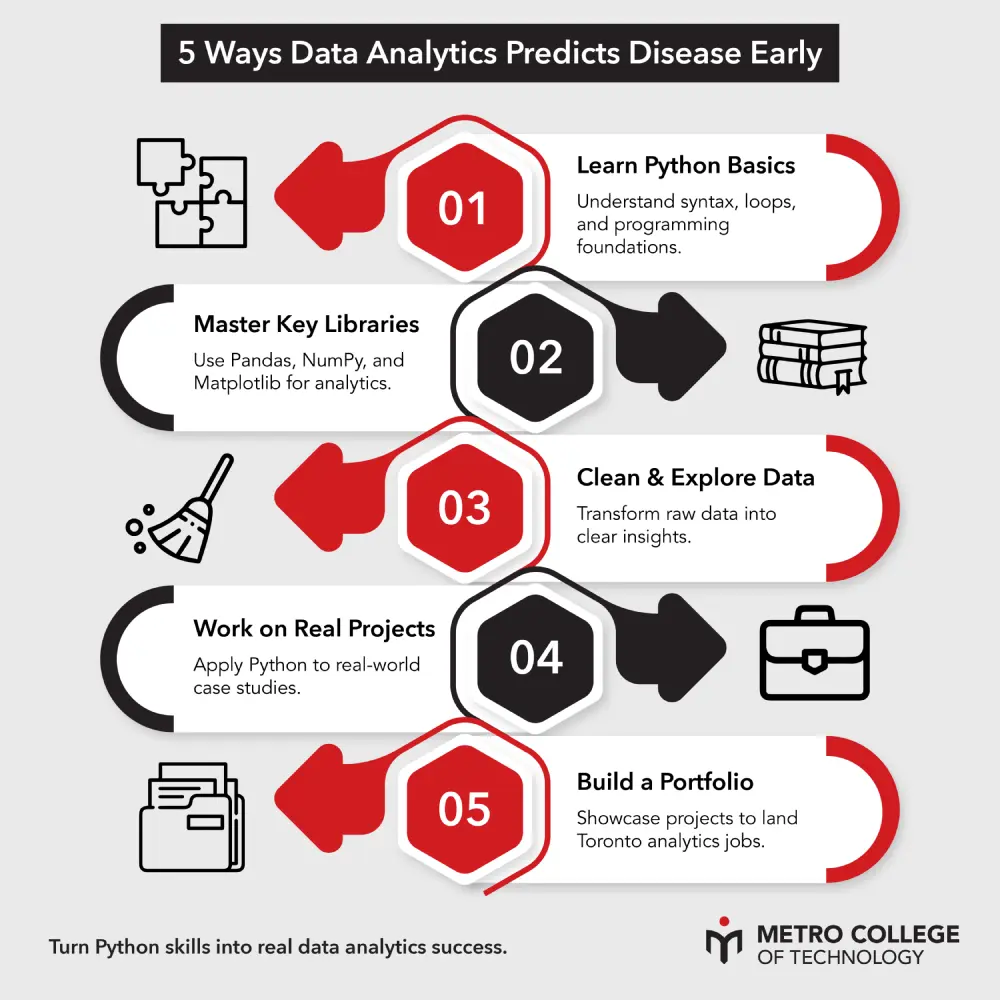
Step 1: Learn Python Basics and Foundational Programming Concepts
Every successful analyst begins with the basics. Python’s straightforward syntax makes it easier to understand how programs think and function. You’ll start by learning variables, data types, operators, loops, and conditionals, the building blocks of logical problem solving. Once you’re comfortable writing small scripts, you’ll begin to see how programming can simplify everyday tasks.
This stage builds your foundation. It’s where you learn the habits that separate casual learners from professionals: writing clean code, commenting clearly, and testing your logic. Understanding these basics prepares you to work efficiently with data structures such as lists, dictionaries, and arrays, which become indispensable as projects grow larger.
Completing this stage in a structured Python for Data Analytics course gives you both accountability and guided practice. Experienced instructors provide practical exercises that replicate workplace scenarios, helping you connect theory with execution.
Step 2: Master Essential Python Libraries for Data Analytics (Pandas, NumPy, Matplotlib)
Once you’re confident with Python fundamentals, it’s time to explore the libraries that power modern analytics. Libraries are pre-built packages that extend Python’s capabilities, saving time and effort. Three stand out in data analysis: Pandas, NumPy, and Matplotlib.
Pandas simplifies data manipulation by giving you tools to organize, filter, and reshape complex datasets. It’s ideal for handling CSV or Excel files and performing tasks like merging tables or removing duplicates. NumPy focuses on mathematical operations and multi-dimensional arrays, enabling large-scale computations that run efficiently. Matplotlib handles visualization, turning data into graphs and charts that make insights visible at a glance.
Together, these libraries form the analytical toolkit that every data professional uses daily. Many learners also complement them with skills in SQL programming to handle database queries or Tableau for business-ready dashboards. The more fluent you become in these libraries, the faster you can analyze, interpret, and communicate results.
Step 3: Develop Skills in Data Cleaning, Wrangling, and Exploratory Data Analysis
Real-world data is messy. It contains gaps, duplicates, and inconsistencies that can distort conclusions. Data cleaning and wrangling are your first lines of defense against poor insights. Using Python, you can detect missing values, remove outliers, and standardize formats to make datasets reliable. Pandas functions make this process efficient, letting you prepare large files without manual intervention.
After cleaning comes exploratory data analysis (EDA), the phase where you identify patterns, trends, and relationships. Visualization tools such as Matplotlib or Seaborn reveal how variables interact. This step helps you answer initial business questions and decide which hypotheses deserve deeper testing.
By practicing EDA consistently, you build analytical intuition, the ability to look at raw numbers and spot what matters. Courses that combine Python for Data Analytics with SAS or Machine Learning and Big Data Analytics training can help refine these techniques for advanced applications.
Step 4: Apply Python to Real-World Data Projects and Case Studies
Theory means little without application. Once you’ve built confidence through exercises, it’s time to work on full projects. Real-world projects simulate professional data challenges, such as predicting sales, analyzing customer behavior, or optimizing logistics. These experiences teach you to define problems clearly, plan workflows, and validate your findings with credible results.
Through guided case studies, you learn how to integrate multiple tools, pulling data with SQL, cleaning it with Pandas, analyzing patterns with NumPy, and visualizing with Matplotlib or Tableau. Each step mirrors what analysts and data scientists do daily across Toronto’s technology, finance, and retail sectors.
Working on live or simulated projects demonstrates your ability to translate data into business value. This is what employers care about most. A solid project portfolio becomes proof of competence, and often the deciding factor in job interviews.
Step 5: Build a Strong Portfolio and Prepare for Job Applications in Toronto
Your portfolio is your professional signature. It tells recruiters what you can do beyond your résumé. Include a mix of short and detailed projects that demonstrate your range, from exploratory reports to predictive modeling. Each project should highlight the problem, your Python approach, and the insight you generated.
A polished GitHub profile or personal website makes your work visible. In Toronto, where data roles are competitive, showcasing your portfolio can help you stand out in industries like banking, healthcare, and digital marketing. Strong technical evidence reinforces your credibility far more than keywords on a résumé ever will.
Finally, prepare for interviews by reviewing statistical concepts, data visualization methods, and coding efficiency. Many training programs include career-readiness modules that guide you through mock interviews and résumé building. These details convert your learning into an employable skill.

Advance Toward a Career in Data Analytics
Build job-ready Python projects, refine your portfolio, and connect with Toronto employers through expert-led training.
Explore Data Analytics CourseImportance of Soft Skills Alongside Python Technical Skills in Data Analytics
Technical ability gets you noticed, yet soft skills sustain your success. Analytical roles require collaboration, communication, and business awareness. Data analysts often work with stakeholders who lack technical backgrounds. The ability to translate numbers into plain-language insights sets you apart.
Communication goes hand in hand with storytelling. Charts and graphs only carry meaning when explained with context. You’ll need to convey complex information through concise presentations, persuasive reports, and actionable recommendations. Clear communication transforms raw analysis into decisions executives can trust.
Adaptability is another asset. Projects rarely follow perfect patterns, and data sources evolve quickly. Flexibility helps you adjust methods, experiment with models, and stay current with emerging tools. Pairing these skills with continuous learning ensures that your expertise grows with the industry.
Employers in Toronto seek professionals who combine accuracy with collaboration. When you pair Python mastery with interpersonal strength, you move beyond a technical specialist role and step into strategic decision-making territory.
FAQ
What jobs can I get after learning Python for data analytics in Toronto?
Completing a Python for data analytics course opens opportunities in positions such as data analyst, business intelligence associate, and operations analyst. Companies across finance, healthcare, retail, and marketing actively hire candidates with Python experience. Entry-level analysts in Toronto can expect competitive salaries that increase rapidly with experience and specialization.
How long does it take to learn Python for data analytics?
Time depends on your learning format and commitment. Many students gain functional proficiency within three to six months of structured learning, especially when training involves hands-on projects. The key is consistent practice and real-world application, focusing on problem-solving rather than memorization.
Do I need a technical background to study Python for data analytics?
A technical background helps but isn’t required. Python’s simple syntax and community support make it accessible to learners from business, finance, or marketing fields. Quality training programs introduce concepts gradually, building confidence through guided examples and practical assignments.
Building Python Coding Skills for Data Analytics Can Help Boost Your Work Credibility
Learning Python for data analytics equips you with the analytical precision employers demand today. By mastering its libraries, developing strong data preparation habits, and applying your skills through real projects, you position yourself for a credible and rewarding career. As Toronto’s job market continues to grow, your ability to turn raw information into actionable business intelligence becomes a clear advantage. Enroll in a recognized Python for Data Analytics training program and turn your technical growth into professional credibility that lasts.

Build Your Python Analytics Foundation with Real Projects
Learn directly from experienced instructors and gain practical, Toronto-focused training that prepares you for real data challenges.
Start Learning Python Today