Data analytics in manufacturing improves quality by turning raw information into practical action. Factories collect enormous volumes of data from machines, sensors, and human input every second. Analyzing this data reveals patterns that improve production accuracy, minimize errors, and strengthen decision-making. When manufacturers understand how to interpret and apply analytics, they uncover opportunities for better control, higher productivity, and sustainable efficiency. This article explores how analytics transforms quality control and provides a roadmap for students learning to manage data in industrial environments.
Key Takeaways:
- Data analytics in manufacturing transforms information into measurable improvements in quality, efficiency, and reliability.
- Real-time analytics, predictive insights, and IoT integration help identify issues before they escalate.
- Understanding analytics frameworks prepares future professionals to lead modern production systems with accuracy and confidence.
Overview of Big Data Analytics Technologies Used in Manufacturing
Big data analytics drives manufacturing intelligence. Every production line generates structured and unstructured data, temperature logs, equipment performance metrics, inspection reports, and operator inputs. Analytics technologies convert this information into organized dashboards and actionable visualizations that guide quality-related decisions. Without structured analysis, valuable insights remain hidden among thousands of unread data points.
Cloud-based analytics platforms now play a central role in processing these large datasets. They offer scalability and integration with machine learning tools that predict failures and optimize workflows. Distributed computing systems handle the heavy lifting, ensuring that even massive volumes of sensor data can be processed in near real-time. By integrating these systems, manufacturing operations become smarter, faster, and more responsive to change.
Students studying data analytics quickly discover how multiple technologies connect within industrial ecosystems. Machine learning algorithms detect unusual machine behavior, artificial intelligence models recommend corrective actions, and Internet of Things (IoT) devices gather live data from production floors. Together, these elements form a complete analytics infrastructure that continuously feeds information back into decision-making systems, enhancing both speed and accuracy.
6 Ways Data Analytics in Manufacturing Help Improve Quality
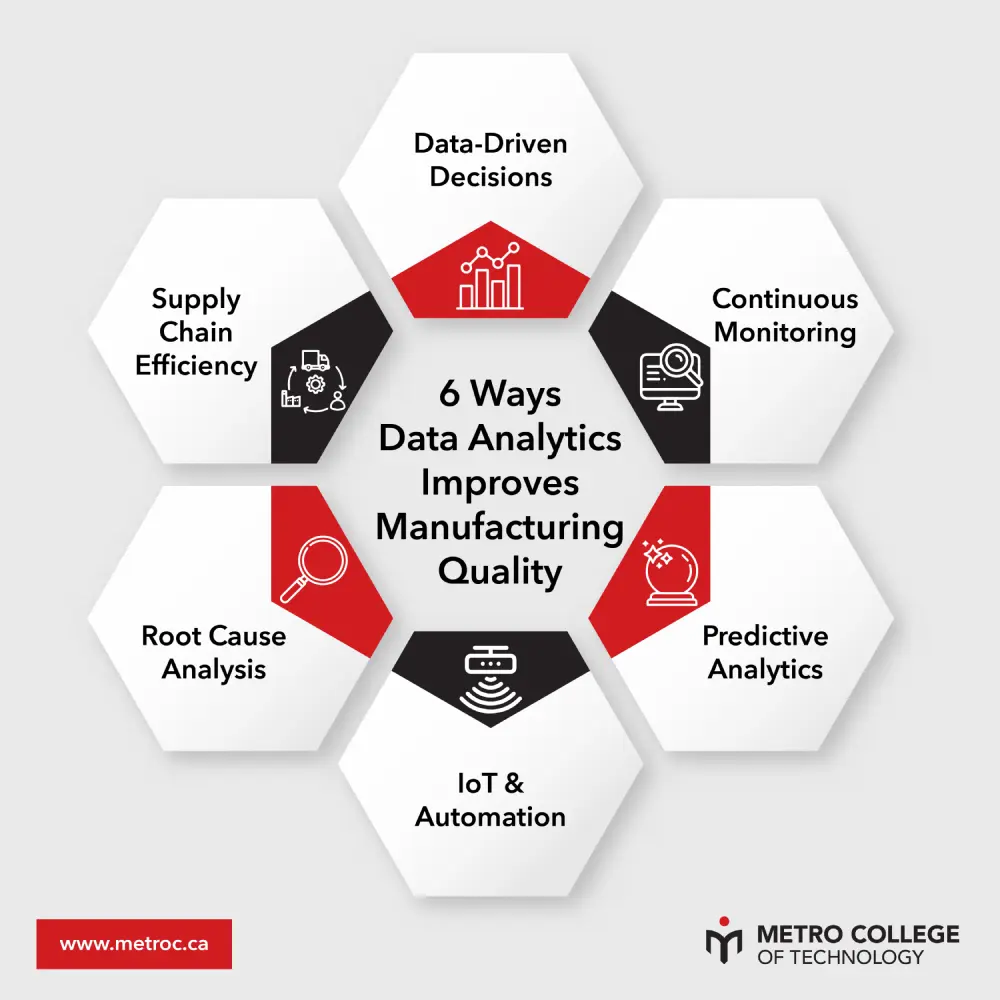
Manufacturing quality depends on precision and consistency. Without structured analysis, decisions rely on observation and intuition alone. By applying data analytics in manufacturing, quality control shifts from reactive problem-solving to proactive improvement. The following six approaches demonstrate how analytics can refine every layer of production, from monitoring and prediction to supply chain coordination.
1. Data-Driven Decision Making to Identify and Address Quality Issues
Every decision in a manufacturing environment affects output quality. Data-driven decision making replaces guesswork with statistical evidence. By analyzing defect rates, production cycle times, and inspection feedback, managers gain a complete picture of performance across departments. When data replaces assumptions, problem areas become visible, measurable, and solvable.
Students learning this discipline develop skills in data visualization, statistical modeling, and variance analysis. These tools allow future professionals to make confident recommendations backed by evidence. A data-driven environment empowers teams to continuously refine performance and meet defined quality standards with precision.
2. Continuous Improvement Through Real-Time Quality Monitoring
Continuous improvement begins with continuous measurement. Real-time analytics captures live data from sensors and inspection systems, immediately identifying when a process moves outside tolerance limits. Operators no longer wait for end-of-day reports; instead, they respond to alerts the moment performance drops.
This approach prevents minor deviations from escalating into large production failures. Real-time monitoring also improves collaboration between departments since everyone works from the same live dashboard. When applied consistently, this cycle of monitoring, response, and improvement keeps production efficient and quality steady.
3. Predictive Analytics for Anticipating Defects and Minimizing Errors
Predictive analytics looks ahead instead of looking back. By training algorithms on historical production data, manufacturers can anticipate when a defect might occur. Predictive models identify patterns that signal potential breakdowns, saving both time and money.
For students, predictive analysis introduces the concept of machine learning in a practical form. It connects data science with operational control. Anticipating defects before they happen reduces scrap rates, improves resource allocation, and extends equipment lifespan, all measurable outcomes of effective analytics adoption.
4. Use of IoT Sensors and Automated Data Collection in Quality Control
IoT sensors capture details no human can consistently record, vibration levels, humidity, temperature, or micro-shifts in machine calibration. Automated data collection ensures that every metric flows into analytics systems without manual input or bias.
This automation increases accuracy and reduces the margin for error. By connecting IoT systems to analytics dashboards, technicians view the full story of production performance in one place. Automation also frees workers to focus on higher-value tasks while the system manages data collection behind the scenes.
5. Root Cause Analysis Enabled by Advanced Data Analytics
When defects appear, identifying their root cause can be complex. Advanced analytics software performs correlation analysis, mapping defects to their exact source. Instead of checking every possible variable, engineers can isolate the most probable contributors, machine configuration, material batch, or operator settings.
Root cause analysis minimizes waste and shortens downtime by targeting corrective action precisely where it is needed. Students learning this process discover how structured problem-solving frameworks such as Pareto analysis and cause-effect diagrams integrate with analytics to create measurable quality improvement.
6. Enhancing Supply Chain and Production Efficiency with Quality Data Insights
Manufacturing quality extends beyond the factory floor. Supply chain performance influences product consistency, delivery times, and material availability. Data analytics tracks supplier performance, lead times, and material quality to maintain production stability.
When combined with internal analytics, supply chain data creates a complete view of operational health. Managers see how supplier reliability affects output and can make informed procurement adjustments. By analyzing the full data ecosystem, manufacturers avoid hidden inefficiencies that quietly increase costs.
Together, these six methods demonstrate how analytics transforms every stage of production into a measurable, controlled process. Consistent data analysis not only maintains quality but also cultivates a continuous improvement culture, something every future professional should understand deeply.
Ready to gain real-world skills in data analytics for manufacturing and quality control?
Metro College’s programs teach you how to use analytical tools, interpret data, and apply insights that improve productivity and product quality across industries.
Explore Machine Learning and Big Data Analytics CourseThe Role of Data Analytics in Lean Manufacturing and Six Sigma Practices
Lean Manufacturing and Six Sigma both focus on reducing waste and improving efficiency. Data analytics acts as their foundation, providing the evidence needed to identify inefficiencies and measure improvement. Without analytics, quality programs rely on limited samples and delayed reporting. With it, every process step becomes traceable and measurable.
Students studying these systems learn how analytics quantifies improvement. Performance metrics such as defect rates, cycle times, and energy usage can be tracked continuously. Integrating analytics into these frameworks transforms traditional process improvement into a data-driven science.
Core applications include:
- Process Standardization: Analytics identifies the most efficient production sequences, helping organizations set standard operating procedures.
- Waste Reduction: Statistical models pinpoint where excess material or energy is being consumed, directly supporting Lean principles.
- Defect Tracking: Continuous data monitoring aligns perfectly with Six Sigma’s goal of near-zero defects, ensuring accuracy across every production batch.
- Performance Benchmarking: Real-time dashboards compare performance across shifts, machines, or facilities, reinforcing accountability and improvement.
- Sustainability Goals: Data analysis measures emissions, resource use, and energy consumption, aligning production with environmental objectives.
By understanding these applications, students can connect theory with practice, bridging statistical control methods with modern analytics systems that elevate quality across manufacturing environments.
FAQ
How does data analytics in manufacturing improve decision-making?
Data analytics improves decision-making by converting raw production data into actionable insights. Managers and engineers no longer rely on assumptions. Instead, they analyze factual performance trends and make evidence-based adjustments that strengthen product consistency and reduce waste.
What skills should students develop to work in manufacturing analytics?
Students should build technical expertise in database management, statistical modeling, and visualization software. Strong analytical thinking and understanding of process workflows are equally valuable. Combining these skills ensures they can interpret data and recommend improvements confidently in industrial environments.
Can data analytics reduce operational costs in manufacturing?
Yes. Analytics identifies inefficiencies, predicts maintenance needs, and optimizes resource allocation. Each of these factors contributes directly to cost savings while improving overall output quality and equipment reliability. Data-driven operations consistently show measurable improvements in ROI.

Take the next step toward a career that combines technology, analytics, and manufacturing innovation.
Metro College’s programs prepare you to analyze data, improve processes, and guide digital transformation in modern production environments.
Explore Tableau for Data Analysis CourseData Analytics in Manufacturing Streamlines and Improves Overall Work Process
Data analytics in manufacturing represents more than a technical skill; it defines the future of production management. Every dataset holds insight that can improve consistency, safety, and sustainability. When students learn to interpret these insights effectively, they become the professionals companies depend on to modernize their systems.
Applying analytics across operations removes inefficiencies, aligns departments, and strengthens collaboration. Quality becomes measurable instead of theoretical. By mastering these principles, you position yourself to lead innovation across manufacturing industries, helping prevent costly errors and driving continuous improvement through data-driven precision.